Monitoring your PC’s performance in real-time is essential for gamers, content creators, power users, and anyone troubleshooting slowdowns, overheating, or bottlenecks. Whether you’re checking CPU usage during gaming, tracking GPU temperatures, or identifying disk thrashing, real-time monitoring helps you spot issues instantly and optimize your system.
As of 2026, Windows (particularly Windows 11 and later builds) includes strong built-in options, while third-party tools provide deeper hardware insights, especially for temperatures, voltages, fan speeds, and per-core details.
Here’s a practical guide covering the most effective methods.
1. Built-in Windows Tools (Quick & No Installation Needed)
Task Manager – The Go-To for Most Users
Task Manager remains the fastest way to view real-time performance in Windows.
How to open it:
- Press Ctrl + Shift + Esc (recommended shortcut), or
- Right-click the taskbar → Task Manager, or
- Ctrl + Alt + Del → Task Manager
Key real-time sections (Performance tab):
- CPU — Shows overall usage, per-core/thread graphs, clock speeds, and power consumption.
- Memory — Real-time usage, speed, in-use vs. available, and composition breakdown.
- Disk — Read/write speeds, active time percentage (100% = potential bottleneck).
- GPU — Usage, temperature (on supported cards), dedicated/video memory, and CUDA/DirectX engine activity.
- Wi-Fi/Ethernet — Upload/download speeds and latency.
- Power (on laptops) — Battery/charging status and estimated remaining time.
Graphs update smoothly in real time. You can right-click graphs for more details or change to logical processors view. Recent Windows 11 updates have modernized the UI with better visuals and quicker refresh rates.
For even quicker access, pin the Performance tab or use the compact view.
Resource Monitor (More Detailed View)
For deeper real-time analysis:
- Open Task Manager → Performance tab → click Open Resource Monitor at the bottom (or search “Resource Monitor” in Start menu).
- Tabs show:
- CPU (per-process usage, services)
- Memory (detailed allocation)
- Disk (per-file read/write activity)
- Network (per-process connections and throughput)
This tool excels at identifying exactly which process hammers your disk or network.
Performance Monitor (Advanced Logging & Counters)
Ideal for long-term tracking or very granular monitoring:
- Search for Performance Monitor (or run perfmon).
- In the left pane, expand Monitoring Tools → Performance Monitor.
- Click the green + icon to add counters (e.g., Processor % Processor Time, Memory Available MBytes, PhysicalDisk % Disk Time, etc.).
- Watch live graphs or create Data Collector Sets for logging.
This built-in tool is powerful for diagnosing intermittent issues.
2. Best Third-Party Tools for Deeper Real-Time Monitoring (2026 Recommendations)
Built-in tools cover basics well, but hardware enthusiasts often want temperature, voltage, fan curves, and per-sensor readings.
Here are the most popular and reliable options in 2026:
- HWiNFO (Free, highly recommended) Extremely detailed sensors for CPU/GPU temperatures, voltages, fan speeds, power draw, and more. Real-time logging and OSD (on-screen display) support. Great for overclockers.
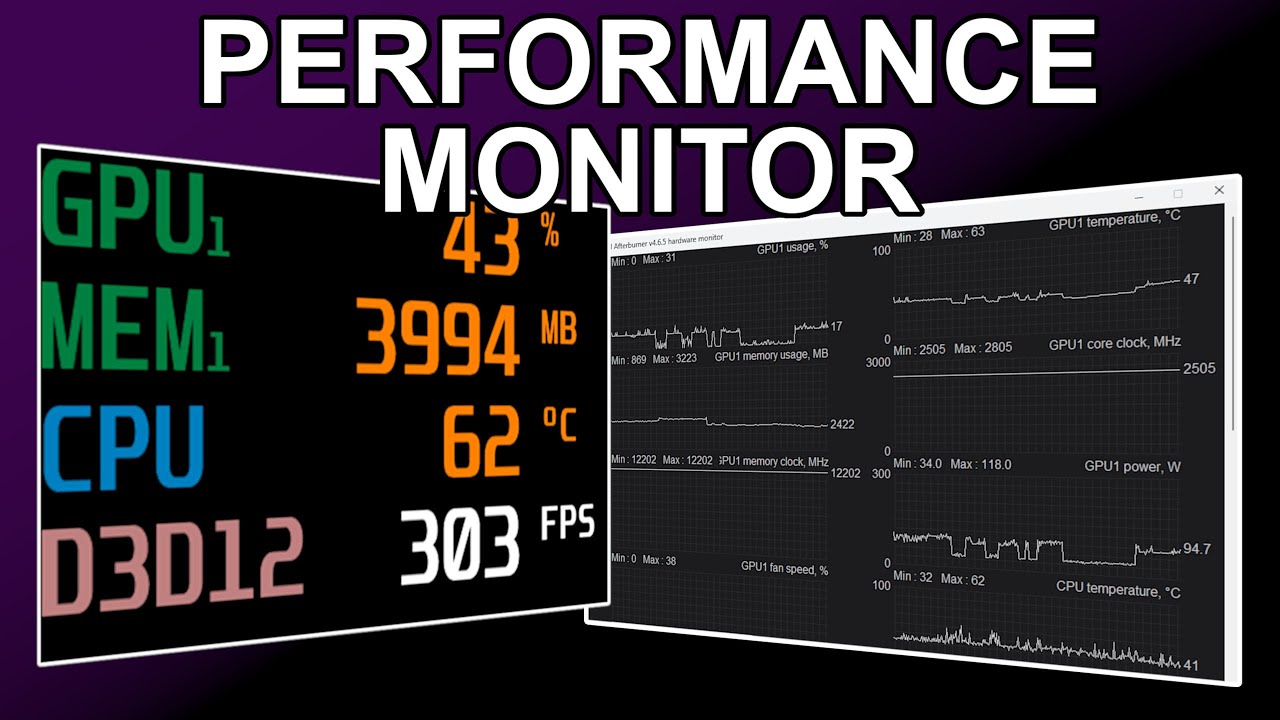
- MSI Afterburner + RivaTuner Statistics Server (Free) The standard for gamers. Monitors GPU/CPU usage, temps, FPS, frame times. Customizable on-screen overlay works in any game/fullscreen app.
- HWMonitor or Core Temp (Free) Lightweight temperature and voltage tracking. HWMonitor shows broad sensor data; Core Temp focuses on accurate per-core CPU temps.
- NZXT CAM or Open Hardware Monitor (Free) CAM offers nice visuals and RGB/fan control alongside monitoring. Open Hardware Monitor is open-source and lightweight.
- AIDA64 (Paid, trial available) Comprehensive system diagnostics with excellent real-time graphs and stress testing.
Many users combine MSI Afterburner (for overlay during games) with HWiNFO (for background detailed logging).
Quick Comparison Table
| Tool | Free? | Best For | Temperatures | On-Screen Display | Ease of Use | Advanced Logging |
|---|---|---|---|---|---|---|
| Task Manager | Yes | Quick checks | Limited | No | Excellent | Basic |
| Resource Monitor | Yes | Process-level details | No | No | Good | No |
| HWiNFO | Yes | Deep hardware sensors | Yes | Yes | Good | Excellent |
| MSI Afterburner | Yes | Gaming + FPS overlay | Yes | Yes (best) | Good | Moderate |
| NZXT CAM | Yes | Modern UI + RGB/fan control | Yes | Limited | Excellent | Good |
| AIDA64 | Paid | Full diagnostics + stress tests | Yes | Yes | Good | Excellent |
Tips for Effective Real-Time Monitoring
- For gaming: Use MSI Afterburner overlay to watch FPS, GPU/CPU usage, and temps without alt-tabbing.
- Suspect overheating? Always monitor temperatures — modern CPUs/GPUs throttle above ~90–95°C.
- High disk usage with low read/write? Check for Windows Search indexing, antivirus scans, or failing drives.
- Update your tools regularly, as new hardware (especially latest AMD/Intel/NVIDIA releases) often needs updated sensor support.
- Combine tools: Task Manager for quick glances + HWiNFO/Afterburner for detailed tracking.
By keeping an eye on these metrics in real time, you’ll catch performance issues early — whether it’s a rogue background process, thermal throttling, or insufficient RAM — and keep your PC running smoothly.